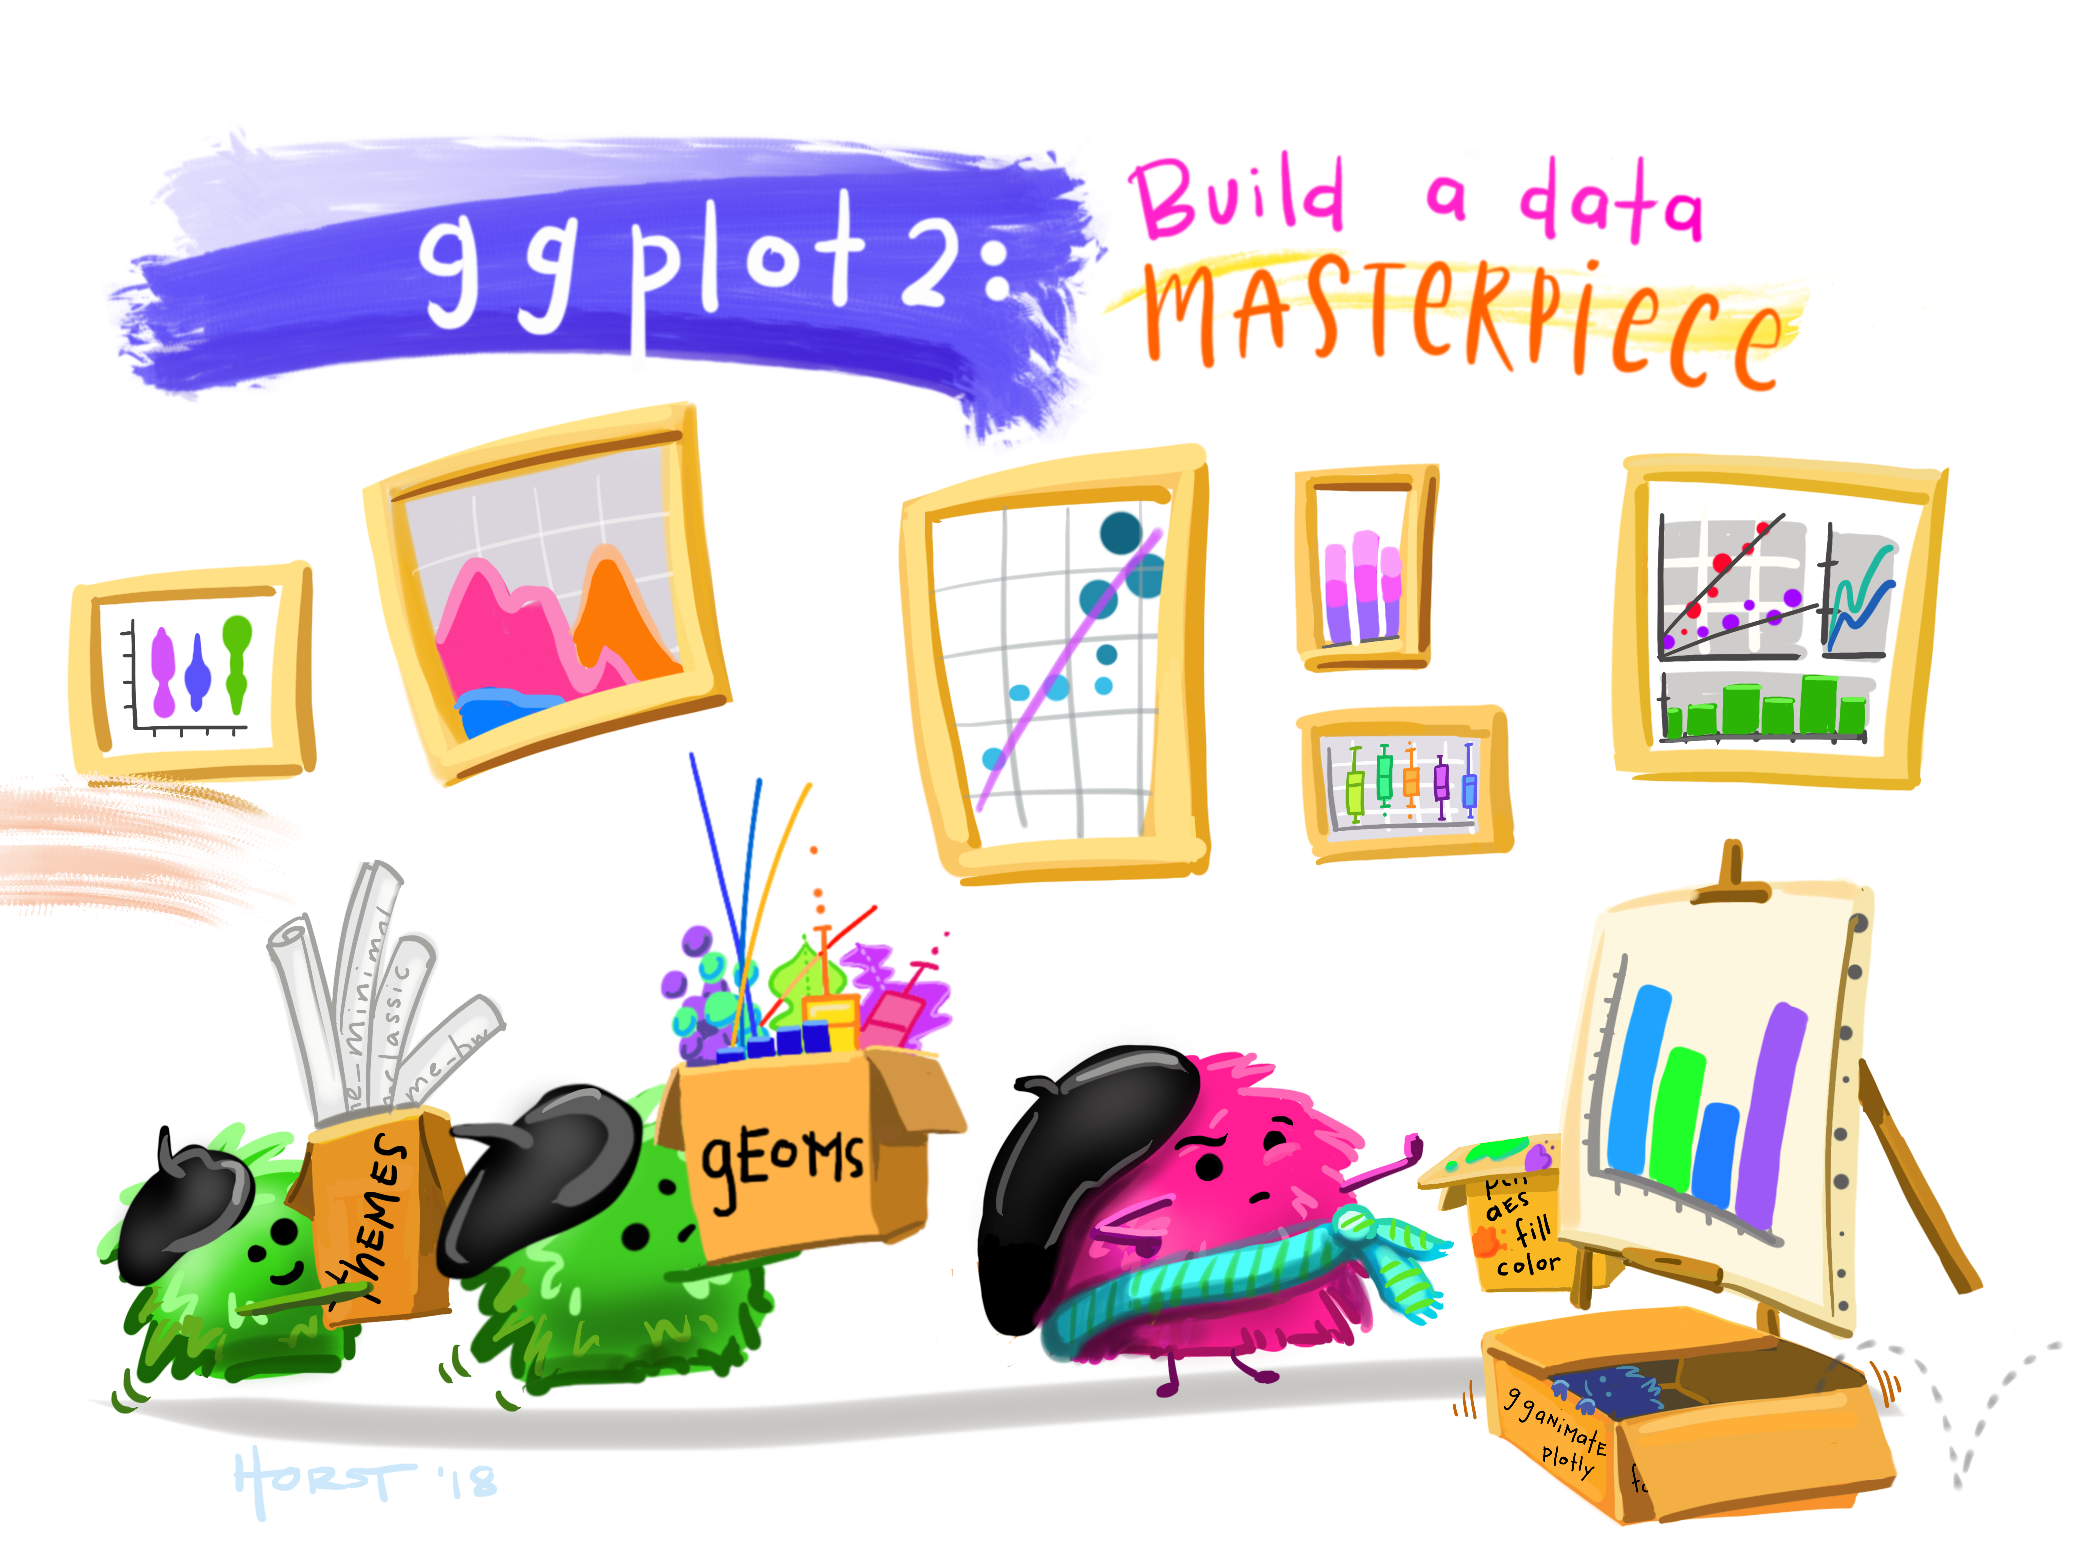
Figure 1: Artwork by @allison_horst.
Agenda
September 7, 2021
- Cholera: what went (didn’t go) well with the graphics?
- Challenger: what didn’t go (went) well with the graphics?
- Thoughts on plotting (with example(s))
Class discussion will be based on Tufte (1997) Visual and Statistical Thinking: Displays of Evidence for Making Decisions. (Use Google to find it.)
Another great reference is the following text: Fundamentals of Data Visualization by Wilke at http://serialmentor.com/dataviz/
September 9, 2021
- Grammar of graphics
- ggplot
Readings
Class notes: Visualization
Tufte (1997) Visual and Statistical Thinking: Displays of Evidence for Making Decisions. (Use Google to find it.)
Wickham (2017) Data Visualization in R for Data Science.
Reflection questions
When creating a graph, try to sketch / image the graph before you code it. What do you want R to do (what is the goal)? In order to do that, what does R need to know?
What should the goal of a plot be? What should the goal of your plot be?
What different aspects deconstruct a plot?
Ethics considerations
Does your plot make the comparison of interest: easily? and accurately?
Did you add alt text to your images (see Writing Alt Text for Data Visualization)?
Is your plot accessible to those who are color blind or looking at the image in black and white?
Slides
In class slides for both 9/7/21 and 9/9/21.
Additional Resources
- DuBois’s images online and in W.E.B. Du Bois’s Data Portraits: Visualizing Black America, a compilation edited by Whitney Battle-Baptiste.
- Flowcharts for choosing appropriate plots, brief tutorials of viz types, and source code in R and Python: from Data to Viz
- See something or Say Something
- Census trends visualized
- Visualization Internship (Fall 2021) at 538
- visualizing data: Digest of the best visualizations from the past month
- A regular NYT column on visualizations: What’s Going on in this Graph?
- Studies about visualizations and perception
- Fundamentals of Data Visualization